Mobile Games Annual Investment Report
2023’s $7.8B Mobile Investments/M&As Marks 4 Year Low
DDM Presents the Mobile Games Annual Investment Report!
We are proud to release the second standalone report, the Mobile Games Annual Investment Report! While it was a great year for some segments, 2023 was particularly a tough year for mobile games companies as mobile investments and M&As totaled $7.8B across 211 transactions (-63% in value and -33% in volume compared to 2022’s $21.0B across 313 transactions), marking a four year low in value for the mobile segment.
Investments
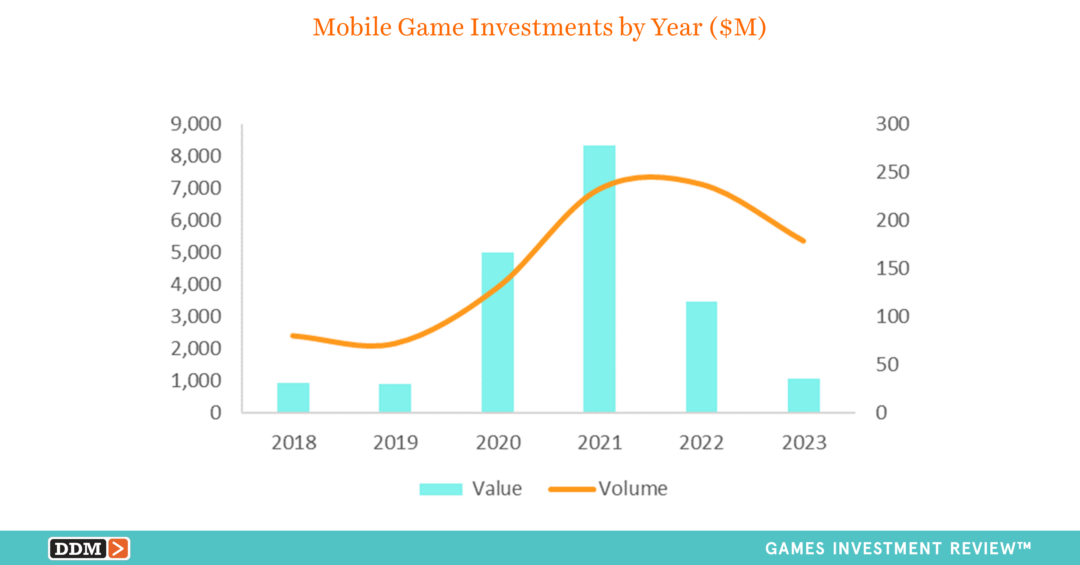
2023 mobile investments totaled $1.1B across 179 investments (-69% in value and -25% in volume compared to 2022’s $3.5B across 238 investments). This drastic decline in value continues a three-year decline of value and volume since mobile games investment peak of $8.3B across 233 investments back in 2021 when Applovin and Playtika both went public with a combined value of $3.9B and market capitalization of $39.7B.
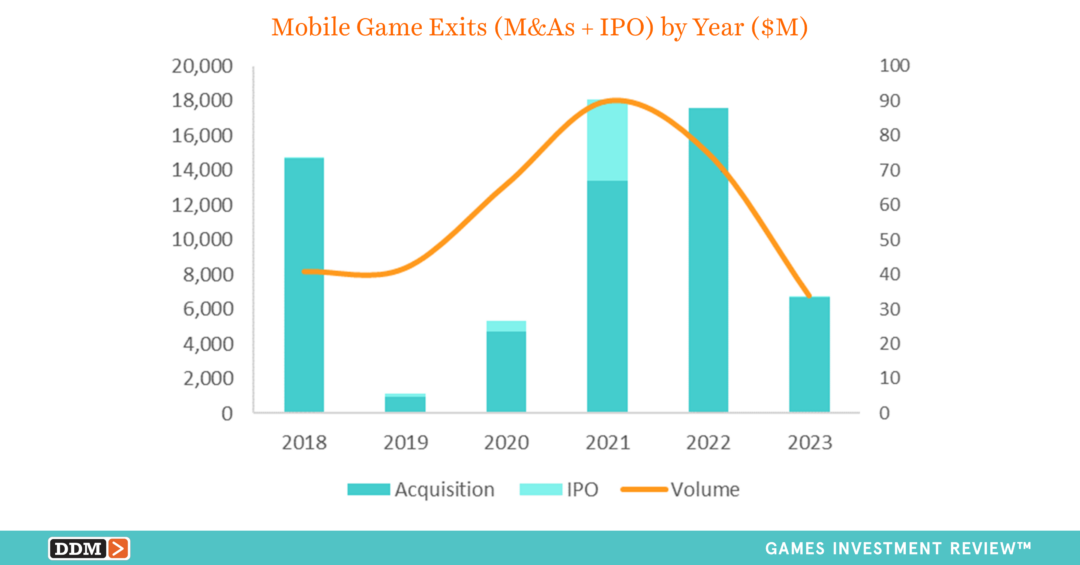
Exits (M&As + IPO) 2023 mobile M&As totaled $6.7B across 32 transactions (-62% in value and -57% in volume compared to 2022’s $17.6B across 75 transactions), ending a trend of increased mobile M&A values that began with 2019’s $923.3M across 40 transactions. 2023 Exits (M&As + IPO) totaled $7.1B across 34 transactions (-60% in value and -55% in volume compared to 2022’s $17.6B across 75 transactions).
Regions
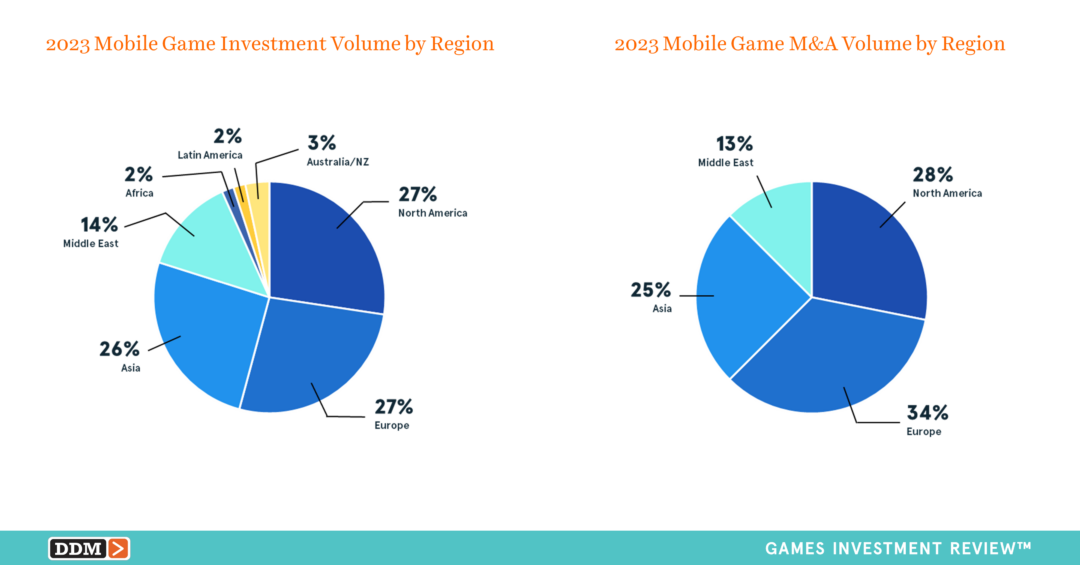
Investors focused on mobile studios within North America, Europe, and Asia where the top three regions were separated by a total of three investments. North American investments led by value and by volume totaling $419.8M across 49 investments (39% of the value and 27% of the volume). Although Asia nearly doubled Europe’s value of $152.2M across 48 investments (14% of the value and 27% of the volume), Asia still came in at third for the most active region totaling $296.4M across 46 investments (28% of the value and 26% of the volume). Similarly to investments, Europe, North America, and Asia were the most active regions for M&As where Europe led the year by volume totaling $819.5M across 11 transactions (12% of the value and 34% of the volume). Whereas North America led by value totaling $4.9B across 9 transactions (73% of the value and 28% of the volume), Asian M&As were not far behind by volume totaling $532.2M across 8 transactions (8% of the value and 25% of the volume).
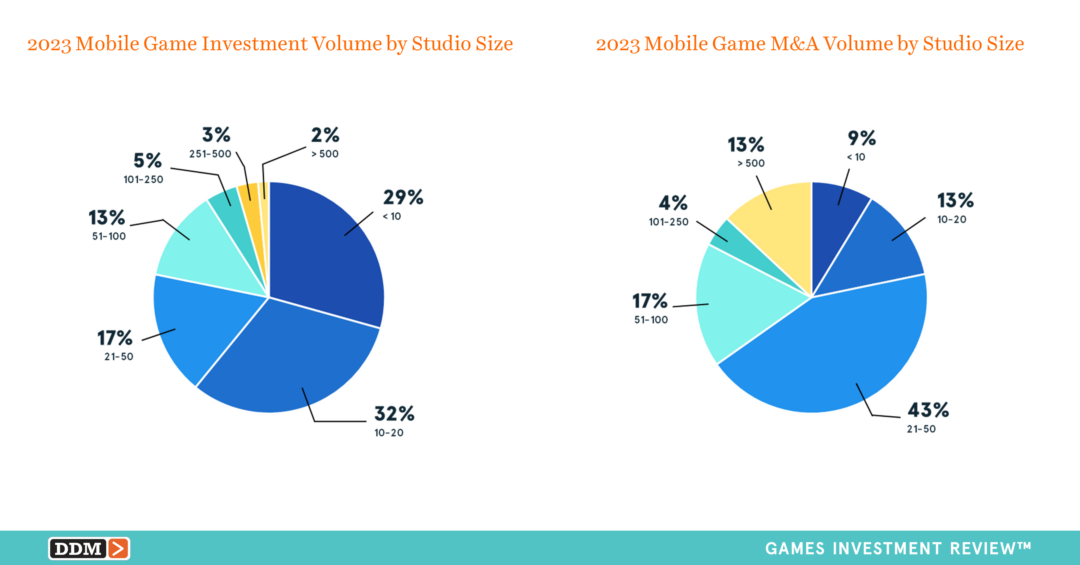
Studio Size
Mobile game studio investors focused on smaller studios (78% with 50 or fewer employees with a median of 15 employees), while acquirers targeted slightly larger studios (74% with 10-100 employees with a median of 36 employees).
Download the Mobile Games Annual Investment Report
Download our free Mobile Games Annual Investment Report or our first standalone report, Game Developers Annual Investment Report. We also offer the full landscape of each quarter’s games investment and M&As in our free Games Investment Review Executive Summary as well as a paid Transaction Bundle available on our website at DDMGamesInvestmentReview.com. We always welcome your feedback at data@ddmagents.com.
P.S. There’s more! We are now releasing content drops!
Follow us at Digital Development Management on LinkedIn for our additional insights tagged #DDMDataPoints or sign up for our newsletter on our website.